State Space Models

All state space models are written and estimated in the R programming language. The models are available here with instructions and R procedures for manipulating the models here here.

Friday, May 23, 2025

About


This blog takes it's title from a book by Nelson Goodman Fact, Fiction and Forecast. The blog documents and explains World-System state pace models and forecasts the results out into the future. No one can know the future and forecasting, at first glance, might seem foolish. Forecasting may or may mot help us understand the future but it does help us understand our quantitative models. So, we keep doing it.

Code for my state space models is available in Google Sites. A list of my blogs is available here. More information about the statistical state space models is available here.

Tuesday, May 6, 2025

World-System (1950-2050): A Range of Forecasts for US Growth


Economic Forecasting during and after the Great Recession took a devastating hit (here and here). Some of the criticism was deserved, others was not. The work of the IPCC provides a way forward. Let me apply the IPCC approach to forecasting the future of the US Economy.

First, when faced with the problem of predicting the future of Climate Change for the World-System, the IPCC acknowledges that the future is unknowable. If something is done to address Climate Change, the future must be different than we can envision it right now. Policy must be able to change the future, but it well might fail. So, instead of making "best" forecasts, the IPCC constructed Emission Scenarios. Each of the scenarios is considered equal likely depending on what policy options are pursued (see the Boiler Plate for examples and links).

My approach to forecasting is a little different but conducted in the same spirit. I have a number of different models of the US Economy with different variables and covering different time periods (here). The models are based on Systems Theory (as are the IPCC Emission Scenarios--again covered in the Boiler Plate). The models produce many different output paths (forecasts) when different assumptions about input variables and estimated model coefficients are made.

For this post, I'm just going to group a few of these outputs into three categories: Steady State, Growth-and-Collapse and Collapse. The time paths for these Business-as-Usual (BAU) models is presented in the graphic above. 


None of the forecasts from my models would be considered acceptable by economic commentators. However, some forecasting models (for example the Atlanta Fed GDPNow model, which is based on an approach similar to mine), are starting to forecast collapsing growth rates (quarterly percentage change in GDP) for the US Economy. 

My models begin forecasting in the year 2000 while the GDPNow models are as current as possible. Predicting collapse scenarios before the Subprime Mortgage Crisis should not be taken as predictions of Economic Crises. The Crises are largely unpredictable shocks to the system that should be presented along with any forecast using shock decomposition diagrams. The shocks are external to the model and cannot be predicted but the effects can be explored (I'll do that in a future post).

I don't know what information economic decision makers actually have or use. But, some of the current extreme policy measures being pursued by the Trump II Administration may (charitably) be interpreted as desperate measures taken in anticipation of growth-and-collapse scenarios for the US Economy.

Notes


If you would like to experiment with my models, the computer code is available here and can be run in a web browser presented with each code Snippet. Explanations about model construction are available in the Boiler Plate.


Friday, May 2, 2025

World-System (1950-2040) Power Outage in Spain and Portugal


A European Power Outage this week in Spain and Portugal (here) suggests it might be an interesting time to compare the economy of Spain (ES), the economy of Portugal (PT) and the economy of Western Europe (WE) and ask what the effects of shocks to these economies might be.

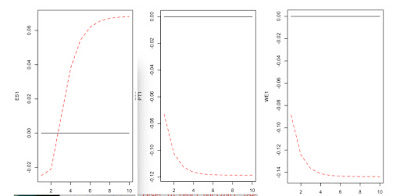
First, let's look at my Business-as-Usual (BAU) forecast for growth in each economy (graphic above) the models run from 1900-2000, forecast until 2040 and do not include the many shocks after 2000 (see below): Portugal (PT) has the best overall growth forecast; Spain (ES) seems to be reaching a steady state and WE is somewhere in between. Things are different after 2040 (see below).


Negative shocks to each country model show that the economies would respond differently. Spain (ES1) has the best recovery but it takes a few years. Portugal (PT1)  and the WE1 react very poorly to negative shocks and essentially do not recover the same level of growth. Shocks to these countries include Great Recession 2020 pandemic1997-2007 real estate bubblethe 2008 financial crisis burst Spain's property bubble, 2008–2014 Spanish financial crisisthe Spanish Real Estate boom and rocketing oil prices,  Spanish property bubble2008–2014, Spanish real estate crisis (the bubble imploded in 2008), record oil prices by the mid-2000s financial crisis of 2007–2008, April 2007 The Economist described Portugal as "a new sick man of Europe", European sovereign debt crisisformation of the European Union (EU) in 1999, the September 11 Attacks in the United States in 2001,  and the Eurozone debt crisis.  ES, PT and WE have all had many shocks to deal with after the turn of the century. 

How do you think the results from my models compare to the conventional analysis of each country (follow the links in the first paragraph for more information)?

Notes

ES1, PT1, and WE1 are the dominant state variables for each model, computed by Principal Components Analysis. Each state variable explains over 80% of the variation in the indicator variables.

Each of the models (ES_M, PT_M and WE_M) are unstable. In the long run, they are all growth-and-collapse models (except for WE_M). You can experiment with each model here. You will notice that economic performance is different after 2040. See if you can find coefficients that will stabilize the economies and produce a steady state at some time in the future. Spain will be the easiest economy to stabilize and I have some hints about how to achieve stability in the code for each model (it essentially involves reducing growth rates as called for by the Limits to Growth report).

Portugal (PT_M) is an interesting case. The economy can be stabilize by setting the growth component (f[1,1] <- 1.0) to a Random Walk (History is just One damned thing after another).

Aside from Portugal, some of the coefficients used to stabilize the model are improbable (exceed either the LCI or the UCI of the bootstrap confidence intervals). To me, this suggests that reaching a steady state economy will take more than Business-As-Usual. One hypothesis is that a steady state economy is better able to handle shocks (you can experiment with with the effects of stabilization here) .


Sunday, March 30, 2025

Boiler Plate


Notes

The first six indicators in standard scores are taken from the World Development Indicators (WDI). KOF = KOF Index of Globalization, EF = Ecological Footprint, HDI = Human Development Index

State Space Model Estimation

The Measurement Matrix for the state space models was constructed using Principal Components Analysis with standardized data from the World Development Indicators. The statistical analysis was conducted in an extension of the dse package. The package is currently supported by an online portal (here) and can be downloaded, with the R-programming language, for any personal computer hereCode for the state space Dynamic Component models (DCMs) is available on my Google drive (here) and referenced in each post.


Atlanta Fed Economy Now

My approach to forecasting is similar to the EconomyNow model used by the Atlanta Federal Reserve. Since the new Republican Administration is signaling that they would like to eliminate the Federal Reserve, the app might well not be available in the future.


While the app is still available, there have been some interesting developments. In earlier forecasts, the Atlanta Fed was showing GDP growth predictions outside the Blue Chip Consensus. Right now, after unorthodox economic policies from the Trump II Administration, the EconomyNow model is predicting a drastic drop in GDP (the Financial Forecast Center is only predicting a slight drop here).

Another comparison for what I have presented above are the IPCC Emission Scenarios. These scenarios are for the World System. Needless to say, (1) the new Right-Wing Republican administration plans on withdrawing the US from all attempts to study or ameliorate Climate Change and (2) the IPCC does not produce any RW modes for the World System (but seem my forecasts here).

Climate Change

Another comparison for what I have presented above are the IPCC Emission Scenarios. These scenarios are for the World System. Needless to say, (1) the new Right-Wing Republican administration plans on withdrawing the US from all attempts to study or ameliorate Climate Change and (2) the IPCC does not produce any RW modes for the World System (but seem my forecasts here).


World System

The longest running set of data we have for the World-System is the Maddison Project based on the work of Angus Maddison (more information is available here). Data on production (Q) and population (N) for most countries and regions runs from years 0-2000. More data becomes available as we near the year 2000. 


Available data were entered in a spreadsheet (see Population above, double click to enlarge). Missing data were interpolated with nonlinear spline smoothing using the R programming Language.


In cases where initial values were not available (see GDP above), the E-M Algorithm was used to estimate initial conditions.

From the graph of GDP above (W_Q) for the World System, it can be seen that economic growth from the year 0-1500 was basically flat. The period of British Capitalism (after 1500) had a small plateau of growth. Takeoff does not happen until the Nineteenth Century.


From a system's perspective, the only model that can be tested for the entire period is Kenneth Boulding's Malthusian Systems Model [Q,N] = f[Q,N].


When developed as a State Space model (measurement matrix above) there are two components: W1=Growth and W2=(Q-N), the Malthusian Controller. When more data is available, the Malthusian Controller can be generalized to other SocioEconomic theories.

What the Malthusian Controller shows (plotted as Q-N above) is that a long-developing Malthusian Crisis (Q<N) started in the Late Middle Ages and accelerated through the period of British Capitalism (Dark Satanic Mills) and was reversed spectacularly during the Nineteenth Century.  Takeoff in response to a deepening Malthusian Crisis would not be an unreasonable way to view Modern Economic Growth.

Hurricane Forecasting

My vision for SocioEconomic system forecasting is to follow the US National Oceanic and Atmospheric Administration's (NOAA) approach to hurricane (Economic Crisis?) forecasting using Spaghetti Models (see below).


Currently, Economic forecasting does not use Multimodel Inference but it is getting there! The best state space model for the US SocioEconomic System in the graphic at the beginning of this post is the World System (W) model based on the AIC Criterion.


Climate Change

Another comparison for what I have presented above are the IPCC Emission Scenarios. These scenarios are for the World System. Needless to say, the new Right-Wing Republican administration plans on withdrawing the US from all attempts to study or ameliorate Climate Change.


Error Correcting Controllers (ECC)


In another post (here), I presented Leibenstein's Malthusian Error Correcting Controller (ECC). It can be generalized to the dominant ECCs in most theoretical economic models (above). These controllers can be further generalized. For example, (X-U) and (L-U) can be generalized to (N-U), a more general Urbanization Controller which describes market expansion for economic growth. In countries and periods with limited data, (N-U) might subsume all these processes. ECCs describe important feedback processes in SocioTechnical System that are typically not recognized as such in academic literature.

Kaya Identity


The basic theoretical model underlying all the World-System models I crate is the Kaya Identity. There are a number of advantages to starting theoretical development with the Kaya Identity: (1) An "identity" is true by definition Adding other variables to the model ensure that theory construction is on a solid footing. (2) The Kaya Identity is also used as the foundation for the IPCC Emissions Scenarios allowing a linkage between World-Systems Theory and the work of the IPCC.


World Development Indicators (WDI)


After WWII, extensive data sets on all countries in the World-System became available from the World Bank (here). The indicators above where chose to construct the state space for each WDI-based model. Addition indicators can be added for specific forecasts and analyses.


Monday, March 17, 2025

World-System (1960-2006) Seven Futures for Argentina


At the 2025 Conservative Political Acton Conference (CPAC, here) meeting in Washington, DC, Argentinian President Javier Milei gifted Elon Musk the "chainsaw for bureaucracy," a symbol of the deep cuts they both want to make in both the US and Argentina's bureaucracy. Elon Musk waved the chainsaw around on stage at CPAC. Milei has been president of Argentina since 2023 and is considered a right-wing libertarian as is Musk (currently). Milei considers himself aligned with the United States although prior Argentinian governments have sought closer ties with China and Russia (according to chatGPT). This post explores which of those Geopolitical Alignments might be best for Argentina. Another post (here), looks at the Economy of Argentina and whether bureaucracy is the problem.

From the time plot above, the BAU model (no input from other countries) exhibits unstable exponential growth, probably what most economists (including Javier Milei) would want. Alignment with China (CN), on the other hand, would produce unstable collapse. How Argentina would isolate itself from the World Economy is unclear but the country does have geopolitical options with China.

The more moderate alignments (the World-System, W, the US and the Latin American Regional economy LAC) all produce stable economic growth and a resulting steady state economy at some time in the future. Although a steady state economy might be preferred for environmental reasons, it is probably not an end-result embraced by current Argentinian elites. You can run the Argentinian state space model (AR20) under these various geopolitical influences here.


Geopolitical Alignment with Russia (RU) produces the strongest unstable exponential growth. Finally, alignment with Mexico (MX) is not much better than a Random Walk (RW).


Since the Random Walk is similar to the political strategy of the current Trump II Administration in the US (here), it is worth simulating the same future path for Argentina in the time plot above.  The result for Argentina is not the same as the US. Under a Random Walk there are neither growth nor collapse scenarios for Argentina.


Notes

The Akaike Information Criterion (AIC) statistics for all the Argentinian models are presented below.

In the Measurement Matrix below, the first six indicators in standard scores are taken from the World Development Indicators (WDI). KOF = KOF Index of Globalization, EF = Ecological Footprint, HDI = Human Development Index


The Error Correcting Controllers (ECC) are (Growth-EF), (LU+EF+KOF-Q), (EF+CO2-KOF-LU). It is interesting and somewhat unusual that, in Argentina, growth is controlled by the Ecological Footprint (EF) and the EF is important in the other two ECCs.

State Space Model Estimation

The Measurement Matrix for the state space models was constructed using Principal Components Analysis with standardized data from the World Development Indicators. The statistical analysis was conducted in an extension of the dse package. The package is currently supported by an online portal (here) and can be downloaded, with the R-programming language, for any personal computer hereCode for the state space models is available on my Google drive (here) and referenced in each post.


Atlanta Fed Economy Now

My approach to forecasting is similar to the EconomyNow model used by the Atlanta Federal Reserve. Since the new Republican Administration is signaling that they would like to eliminate the Federal Reserve, the app might well not be available in the future.


While the app is still available, there have been some interesting developments. In earlier forecasts, the Atlanta Fed was showing GDP growth predictions outside the Blue Chip Consensus. Right now, after unorthodox economic policies from the Trump II Administration, the EconomyNow model is predicting a drastic drop in GDP (the Financial Forecast Center is only predicting a slight drop here).

Climate Change

Another comparison for what I have presented above are the IPCC Emission Scenarios. These scenarios are for the World System. Needless to say, (2) the new Right-Wing Republican administration plans on withdrawing the US from all attempts to study or ameliorate Climate Change and (2) the IPCC does not produce any RW modes for the World System (but seem my forecasts here).


Sunday, March 2, 2025

World-System (1980-2060) Seven Futures for Ukraine


The presidents of Ukraine (Volodymyr Zelenskyy) and the United States (Donald Trump) recently met (Mar 2, 2025) at the White House to discuss the future of Ukraine and a mineral extraction deal. The meeting was not a success. On March 11, 2025, after a telephone call between President Trump and Vladimir Putin, Ukraine tentatively agreed to 30-day cease fire. It is still not clear whether Russia will abide by the cease fire.

In my mind, these developments bring up the question about what Geopolitical alignment would be best for Ukraine (UA): Russia (RU), the World System (W), the European Union (EU), the United States (US) or none (BAU or RW). The graphic above shows the time plot for the growth component of the UAL20 model under each alternative Geopolitical Alignment. Maybe surprisingly, the US Geopolitical Alignment would be one of the worst! In this post I'll explain the alternative forecasts in detail.

  • BAU [103.6 < AIC= 108.73 < 112.3] The Business As Usual (BAU) provides the best future forecast and the AIC is right in the middle of the pack. However, at this moment in history, it seems that Ukraine will not be isolated from Geopolitical entanglements.
  • WORLD [96.17 < AIC = 106.4 < 115.6] Alignment with the World-System would produce a collapse mode, but not the worst.
  • US [99.01 < AIC = 106.6 < 113.2] Alignment with the US produces one of the worst collapse scenarios.
  • EE [22.18 < AIC =  76.07 < 120.7] Alignment with Eastern Europe also produces a collapse scenario but with recovery around 2050.

None of these growth scenarios look great and some are awful for Ukraine. Geopolitical alignment with Russia would currently mean a massive military loss for Ukraine. If, however, Russia were to eventually follow it's best future (alignment with the European Union), the picture would be very different. 

NOTES

The systemic growth state variable (UK1) is interesting in that CO2 (-0.44492), GDP (-0.0949) and Labor Force (-0.431) enter negatively.These negative weightings mean that, in Ukraine, growth is under Error Correction and Control: (Growth-CO2-L). I will have more to say about the result in the discussion of the Ukrainian economy (here).


The first six indicators in standard scores are taken from the World Development Indicators (WDI). KOF = KOF Index of Globalization, EF = Ecological Footprint, HDI = Human Development Index

You can run the full UAL20 BAU model here and explore the other Error Correcting Controllers (ECC) which have complicated Malthusian elements.

Tuesday, February 25, 2025

World-System (1960-2100) Six Futures for the World System


In January of 2025, the IMF released an update to the World Economic Outlook (WEO) which addressed growth, inflation and other economic indicators for the World-System. The general conclusion was that global growth is "divergent and uncertain". The WEO does not provide forecasts or scenarios (see the IPCC Emission Scenarios) for the World-System and only looks back over a handful of years when analyzing economic trends. In this post, I will take a Systems Perspective and look at the World System growth component (W1, see below in the Notes) from 1960 to 2100.

In their analysis, the IMF was primarily focused on the rate of change in GDP. From Systems Perspective, we can look at the rate of change in overall system growth from (1960-2010, above). The average rate of change was -11.52884%  but the mean is heavily weighted by the period around the 1980's when the World System was in crisis (the early 1980's recession). Although growth rates are decreasing in the World System, it is difficult from the graph above to decide whether or not the system is stagnating or reaching a steady state. For that answer we need to estimate system models.

I've estimate six systems models. The difference between the models involves only the input variables which are chosen based on different Geopolitical Alignments for the World System (see below in the Notes).


The first group of models (graphed above) compares the US and the World model (WL20) to a Random Walk (RW) and to the Business As Usual (BAU) model. These models provide a range of growth from stable linear growth (BAU) to growth-and-collapse models (WL20 and US). The Random Walk (RW) provides the baseline.


The next set of models (graphed above) compares stable exponential growth (the RULM model, late Modern) to a stable decline model (WL20W). Again, the RW model provides a baseline. 
In the final set of models (graphed above), I compare the China Model (CH, stable growth) to the Russian Late 20th Century model (RUL20, unstable cyclical growth). Geopolitical Alignments with Russia and China, in these models, would end up in the same place in 2100, but the RUL20 model would be a rougher ride.


The six models above offer a range of reasonable futures for the World System but there are some surprises.  The RULM model (stable exponential growth), the Growth and Collapse models (US and WL20) and the collapse model (CH) would probably not have been predicted in advance from arm-chair speculations. But, no one knows the future. The models themselves are speculative (but at least estimated from historical data) and meant for discussion and analysis. However, the alternative models, I would argue, are better than presenting one simple BAU model (for example, the DICE model) and assuming that growth will continue linearly for the foreseeable future.

The results of the forecasts above are a direct result of the behavior of the country model assumed to be the hegemonic leader dominating the World System. Using the AIC (see below), the best model is the WL20 model (AIC=-3.91), a BAU model that assumes no hegemonic leader.

Notes

The World System growth component is the  first principal component state variable for the WL20 model.


The Measurement Matrix for the WL20 model is presented above. The W1 Component (state variable) is an approximately equal and positive weighting of all the indicators except for the Living Planet Index (the planet is becoming less livable) and measures overall growth in the World System (rather than just GDP).

The six models estimated for the World System WL20 model are based on six different Geopolitical Alignments:
  • BAU The Business As Usual (BAU) model assumes no input variables and thus no preferred hegemonic geopolitical alignment for the World System
  • RW The Random Walk (RW) model assumes that the World System responds randomly to shocks from the member states. Today is like tomorrow except for random shocks (just one damned thing after another).
  • W The World System model (W) assumes that the W1 state variable is driven entirely by other state variables in the system, W2 and W3 respectively (in some analyses, more state variables could be added).
  • US The United States (US) model assumes that the US is the hegemonic leader of the world system.
  • RU The Russia (RU) model assumes that Russia is the hegemonic leader of the World System.
  • CH The China (CH) model assumes that China is the hegemonic leader of the World System.
Of the geopolitical linkage models, the US model (AIC=109.57), the WL20 model (AIC=-3.91), the RU model (AIC=117.95) and the CH model (AIC=136.50) were the best using the Akaike Information Criterion (AIC). Of these models, the WL20, the US, the CH and the RU models were stable (dominant eigenvalue < 1.0).

In general, the indicators in standard scores are taken from the World Development Indicators (WDI). KOF = KOF Index of Globalization, EF = Ecological Footprint, HDI = Human Development Index

The models used for input variables can be viewed and run here.