
A European Power Outage this week in Spain and Portugal (here) suggests it might be an interesting time to compare the economy of Spain (ES), the economy of Portugal (PT) and the economy of Western Europe (WE) and ask what the effects of shocks to these economies might be.
First, let's look at my Business-as-Usual (BAU) forecast for growth in each economy (graphic above) the models run from 1900-2000, forecast until 2040 and do not include the many shocks after 2000 (see below): Portugal (PT) has the best overall growth forecast; Spain (ES) seems to be reaching a steady state and WE is somewhere in between. Things are different after 2040 (see below).
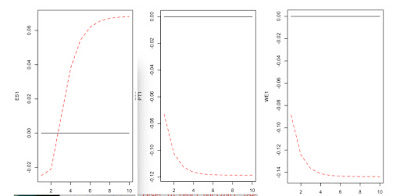
Negative shocks to each country model show that the economies would respond differently. Spain (ES1) has the best recovery but it takes a few years. Portugal (PT1) and the WE1 react very poorly to negative shocks and essentially do not recover the same level of growth. Shocks to these countries include Great Recession, 2020 pandemic, 1997-2007 real estate bubble, the 2008 financial crisis burst Spain's property bubble, 2008–2014 Spanish financial crisis, the Spanish Real Estate boom and rocketing oil prices, Spanish property bubble, 2008–2014, Spanish real estate crisis (the bubble imploded in 2008), record oil prices by the mid-2000s, financial crisis of 2007–2008, April 2007 The Economist described Portugal as "a new sick man of Europe", European sovereign debt crisis, formation of the European Union (EU) in 1999, the September 11 Attacks in the United States in 2001, and the Eurozone debt crisis. ES, PT and WE have all had many shocks to deal with after the turn of the century.
How do you think the results from my models compare to the conventional analysis of each country (follow the links in the first paragraph for more information)?
Notes
ES1, PT1, and WE1 are the dominant state variables for each model, computed by Principal Components Analysis. Each state variable explains over 80% of the variation in the indicator variables.
Each of the models (ES_M, PT_M and WE_M) are unstable. In the long run, they are all growth-and-collapse models (except for WE_M). You can experiment with each model here. You will notice that economic performance is different after 2040. See if you can find coefficients that will stabilize the economies and produce a steady state at some time in the future. Spain will be the easiest economy to stabilize and I have some hints about how to achieve stability in the code for each model (it essentially involves reducing growth rates as called for by the Limits to Growth report).
Portugal (PT_M) is an interesting case. The economy can be stabilize by setting the growth component (f[1,1] <- 1.0) to a Random Walk (History is just One damned thing after another).
Aside from Portugal, some of the coefficients used to stabilize the model are improbable (exceed either the LCI or the UCI of the bootstrap confidence intervals). To me, this suggests that reaching a steady state economy will take more than Business-As-Usual. One hypothesis is that a steady state economy is better able to handle shocks (you can experiment with with the effects of stabilization here) .
No comments:
Post a Comment