The field of Development Economics is based on the idea of Convergence: Because underdeveloped economies have faster growth rates than developed economies, all economies will eventually converge in terms of per capita income (taken as a proxy for the standard of living). Convergence holds out hope to developing economies: adopt Western economic models, open your economies to global trade and eventually your citizens will enjoy the same high standard of living as the US.
Unfortunately, the Convergence model is based on three faulty assumptions: (1) Every economy has basically the same underlying economic model differing only in parameter values, (2) We only need to consider economic variables e.g., Gross Domestic Product (GDP) and (3) There is no such thing as a world-system, we only have isolated countries that can interact independently through global trade.

The first two assumptions can be summarized with the Neoclassical Economic Growth Model (the Solow-Swan Model with a Cobb-Douglas production function).

The causal directed graph (path diagram) for the model is displayed above. One portion of the population (N) is employed as labor (L). Labor and exogenous technological change (T) drive output (Q). Capital stock (K) and Energy Consumption (E) are endogenous variables, that is, produced through economic activity. The final output is Consumption (C). If the model is estimated from data, there can also be error terms and shocks (V2 and V3). Sometimes land (NR, natural resources) is included as an input, but often resources are ignored.
Every country is assumed to have the same basic economic models (see for example the William Nordhaus DICE and RICE models) differing only in parameter values (rates of population growth, rates of technological change, labor productivity, rates of investment, etc.). If you accept the model, it is easy to reason that rapid population growth and rapid technological change will lead to higher capital investment, higher consumption (but not necessarily consumption per capita) and higher energy use. Since there is typically higher population growth in less developed economies and since technology (knowledge) is a public good, then the predicted catch-up or convergence follows directly from the model. Needless to say, not all economists agree with the model or agree that it is supported by data, but enough do so that it contains the dominant thinking on economic growth.
The model is myopic; it ends with consumption and energy use but does not consider the environmental impacts. The assumed counterfactual is that all countries can reach the US standard of living without environmental impacts. We can include a measure of environmental impact by adding the Ecological Footprint (EF) to the model (but see the WARNING note below). The EF measures the human demand on nature. It compares human consumption of environmental resources (demand) to biological capacity (BioCap in the directed graph above, environmental supply). Biocapacity is the biologically productive area within the country, a measure that is different from total land area because some land is unproductive (e.g, the majority of land underneath major metropolitan areas or in deserts). The ratio of consumption per capita to biocapacity per capita measures the EF or carrying capacity of the physical environment. If consumption exceeds biocapacity, the level of consumption is not sustainable unless supplemented by trade or unless technological change increase biocapacity. Obviously, not all countries can exceed biocapacity and make it up through trade. Carrying capacity without trade can be exceeded in the short run but is eventually unsustainable because the environment continues to loose biocapacity (the self-loop in the directed graph), that is, looses the ability to meet the demands placed on it.
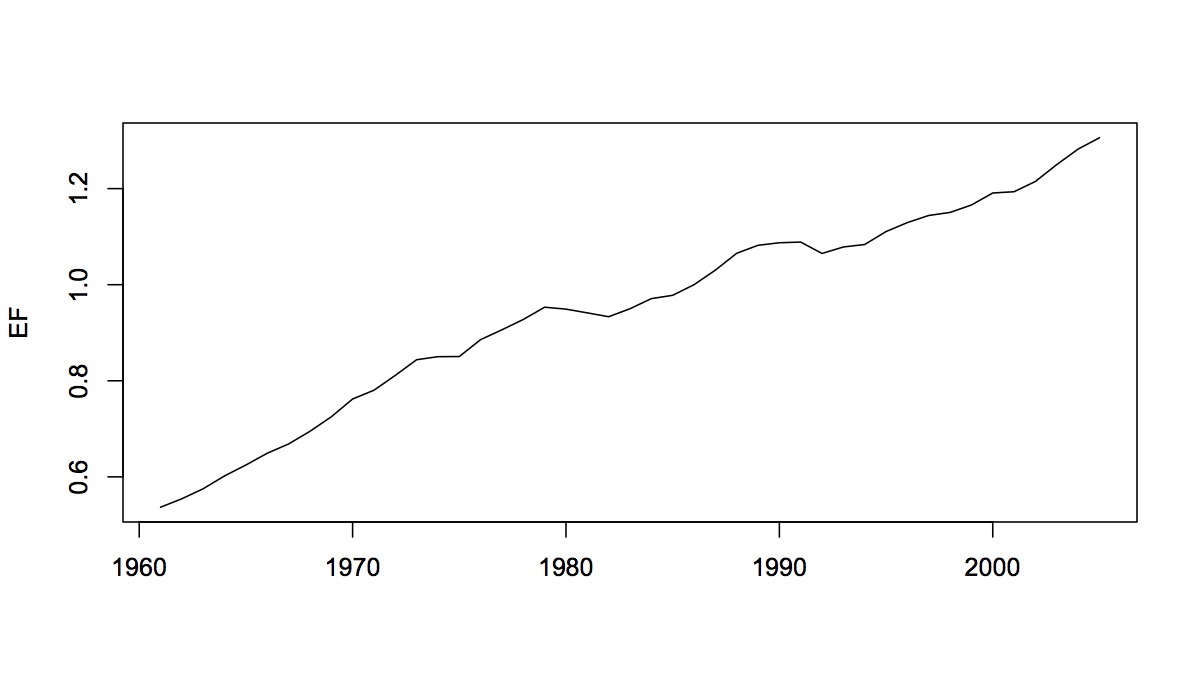
The EF for the world system is displayed in the first time series plot at the start of this post. Somewhere around the 1990s, the world system supposedly exceed it's carrying capacity (EF > 1.0). The world system did not collapse in the 1990s but, by this measure, we have been degrading our environmental support systems since then.

We can run some simple counterfactuals with EF data. For example, the graph above assigns US consumption levels to every individual in the world population but assumes no improvement of biocapacity. By 2020 (forecasting using the WL20 model), we would need the current biocapacity of almost five Earths to meet consumption demand.

If we were to assume that biocapacity of the entire world system reached the current biocapacity of the US, we would top out at around 2.5 Earths by 2500. It seems unlikely that biocapacity will reach US levels throughout the world, especially in arid countries. A reasonable prediction might be somewhere between these two forecasts.
The conclusion from this exercise is that convergence between all the economies in the world-system is seems unlikely. The US lifestyle is, in this sense, unsustainable. Either the US (and a few other Northern countries) will have to reduce its standard of living, be forced to reduce its standard of living (the ecological collapse after 2050 in the first forecast) or it will always have dominant economies. Even if the US would gladly reduce its standard of living to some low level (it's unlikely that any economy would) what would that level be and how many people in the world system could share it without degrading environmental systems? And, what will happen when the less developed world realizes that there is no hope of sharing Western standards of living? And, what might the world look like after an ecological collapse? More importantly, since the future really cannot be known, what do less developed countries do in the short run? I'll address that question in future posts.
WARNING: The Ecological Footprint (EF) is a measure which has been widely criticized and, at one extreme, called scientifically useless. From a statistical perspective, these critiques describe construct validity: does the EF construct measure what it claims to measure. There are many arbitrary assumptions in the construction of the EF (that is, the one supplied by the Global Footprint Network and used above) and the EF has become overburdened with sustainability interpretations that make it hard to know what is "supposed" to be measured. But there are other types of validity: face validity (does the measure superficially look right), content validity (are the right indicators being included in the measure) and criterion validity (is the measure useful in models and is it related to other measures in a reasonable way). My interest has been in the criterion validity of the EF. As can be seen above, it is useful in models and can be predicted (the dashed blue and green lines are the 98% bootstrap prediction intervals). Does it really mean that we might use five times our current biocapacity at some time in the future? No! If we give up the idea that this must be an absolutely correct measure, we can still ask relative questions that are interesting: how does it change over time and in different countries? How is it related to other measures of economic development? Can we construct alternative EF measures and how do they correlate to the one provided by the Global Footprint Network. I'll present some of this analysis in future posts.