State Space Models

All state space models are written and estimated in the R programming language. The models are available here with instructions and R procedures for manipulating the models here here.

Friday, May 23, 2025

About


This blog takes it's title from a book by Nelson Goodman Fact, Fiction and Forecast. The blog documents and explains World-System state pace models and forecasts the results out into the future. No one can know the future and forecasting, at first glance, might seem foolish. Forecasting may or may mot help us understand the future but it does help us understand our quantitative models. So, we keep doing it.

Code for my state space models is available in Google Sites. A list of my blogs is available here. More information about the statistical state space models is available here.

Tuesday, May 6, 2025

World-System (1950-2050): A Range of Forecasts for US Growth


Economic Forecasting during and after the Great Recession took a devastating hit (here and here). Some of the criticism was deserved, others was not. The work of the IPCC provides a way forward. Let me apply the IPCC approach to forecasting the future of the US Economy.

First, when faced with the problem of predicting the future of Climate Change for the World-System, the IPCC acknowledges that the future is unknowable. If something is done to address Climate Change, the future must be different than we can envision it right now. Policy must be able to change the future, but it well might fail. So, instead of making "best" forecasts, the IPCC constructed Emission Scenarios. Each of the scenarios is considered equal likely depending on what policy options are pursued (see the Boiler Plate for examples and links).

My approach to forecasting is a little different but conducted in the same spirit. I have a number of different models of the US Economy with different variables and covering different time periods (here). The models are based on Systems Theory (as are the IPCC Emission Scenarios--again covered in the Boiler Plate). The models produce many different output paths (forecasts) when different assumptions about input variables and estimated model coefficients are made.

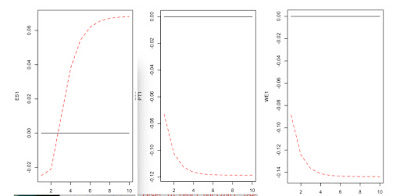
For this post, I'm just going to group a few of these outputs into three categories: Steady State, Growth-and-Collapse and Collapse. The time paths for these Business-as-Usual (BAU) models is presented in the graphic above. 


None of the forecasts from my models would be considered acceptable by economic commentators. However, some forecasting models (for example the Atlanta Fed GDPNow model, which is based on an approach similar to mine), are starting to forecast collapsing growth rates (quarterly percentage change in GDP) for the US Economy. 

My models begin forecasting in the year 2000 while the GDPNow models are as current as possible. Predicting collapse scenarios before the Subprime Mortgage Crisis should not be taken as predictions of Economic Crises. The Crises are largely unpredictable shocks to the system that should be presented along with any forecast using shock decomposition diagrams. The shocks are external to the model and cannot be predicted but the effects can be explored (I'll do that in a future post).

I don't know what information economic decision makers actually have or use. But, some of the current extreme policy measures being pursued by the Trump II Administration may (charitably) be interpreted as desperate measures taken in anticipation of growth-and-collapse scenarios for the US Economy.

Notes


If you would like to experiment with my models, the computer code is available here and can be run in a web browser presented with each code Snippet. Explanations about model construction are available in the Boiler Plate.


Friday, May 2, 2025

World-System (1950-2040) Power Outage in Spain and Portugal


A European Power Outage this week in Spain and Portugal (here) suggests it might be an interesting time to compare the economy of Spain (ES), the economy of Portugal (PT) and the economy of Western Europe (WE) and ask what the effects of shocks to these economies might be.

First, let's look at my Business-as-Usual (BAU) forecast for growth in each economy (graphic above) the models run from 1900-2000, forecast until 2040 and do not include the many shocks after 2000 (see below): Portugal (PT) has the best overall growth forecast; Spain (ES) seems to be reaching a steady state and WE is somewhere in between. Things are different after 2040 (see below).


Negative shocks to each country model show that the economies would respond differently. Spain (ES1) has the best recovery but it takes a few years. Portugal (PT1)  and the WE1 react very poorly to negative shocks and essentially do not recover the same level of growth. Shocks to these countries include Great Recession 2020 pandemic1997-2007 real estate bubblethe 2008 financial crisis burst Spain's property bubble, 2008–2014 Spanish financial crisisthe Spanish Real Estate boom and rocketing oil prices,  Spanish property bubble2008–2014, Spanish real estate crisis (the bubble imploded in 2008), record oil prices by the mid-2000s financial crisis of 2007–2008, April 2007 The Economist described Portugal as "a new sick man of Europe", European sovereign debt crisisformation of the European Union (EU) in 1999, the September 11 Attacks in the United States in 2001,  and the Eurozone debt crisis.  ES, PT and WE have all had many shocks to deal with after the turn of the century. 

How do you think the results from my models compare to the conventional analysis of each country (follow the links in the first paragraph for more information)?

Notes

ES1, PT1, and WE1 are the dominant state variables for each model, computed by Principal Components Analysis. Each state variable explains over 80% of the variation in the indicator variables.

Each of the models (ES_M, PT_M and WE_M) are unstable. In the long run, they are all growth-and-collapse models (except for WE_M). You can experiment with each model here. You will notice that economic performance is different after 2040. See if you can find coefficients that will stabilize the economies and produce a steady state at some time in the future. Spain will be the easiest economy to stabilize and I have some hints about how to achieve stability in the code for each model (it essentially involves reducing growth rates as called for by the Limits to Growth report).

Portugal (PT_M) is an interesting case. The economy can be stabilize by setting the growth component (f[1,1] <- 1.0) to a Random Walk (History is just One damned thing after another).

Aside from Portugal, some of the coefficients used to stabilize the model are improbable (exceed either the LCI or the UCI of the bootstrap confidence intervals). To me, this suggests that reaching a steady state economy will take more than Business-As-Usual. One hypothesis is that a steady state economy is better able to handle shocks (you can experiment with with the effects of stabilization here) .